Introduction to Real-Time Freight Tracking
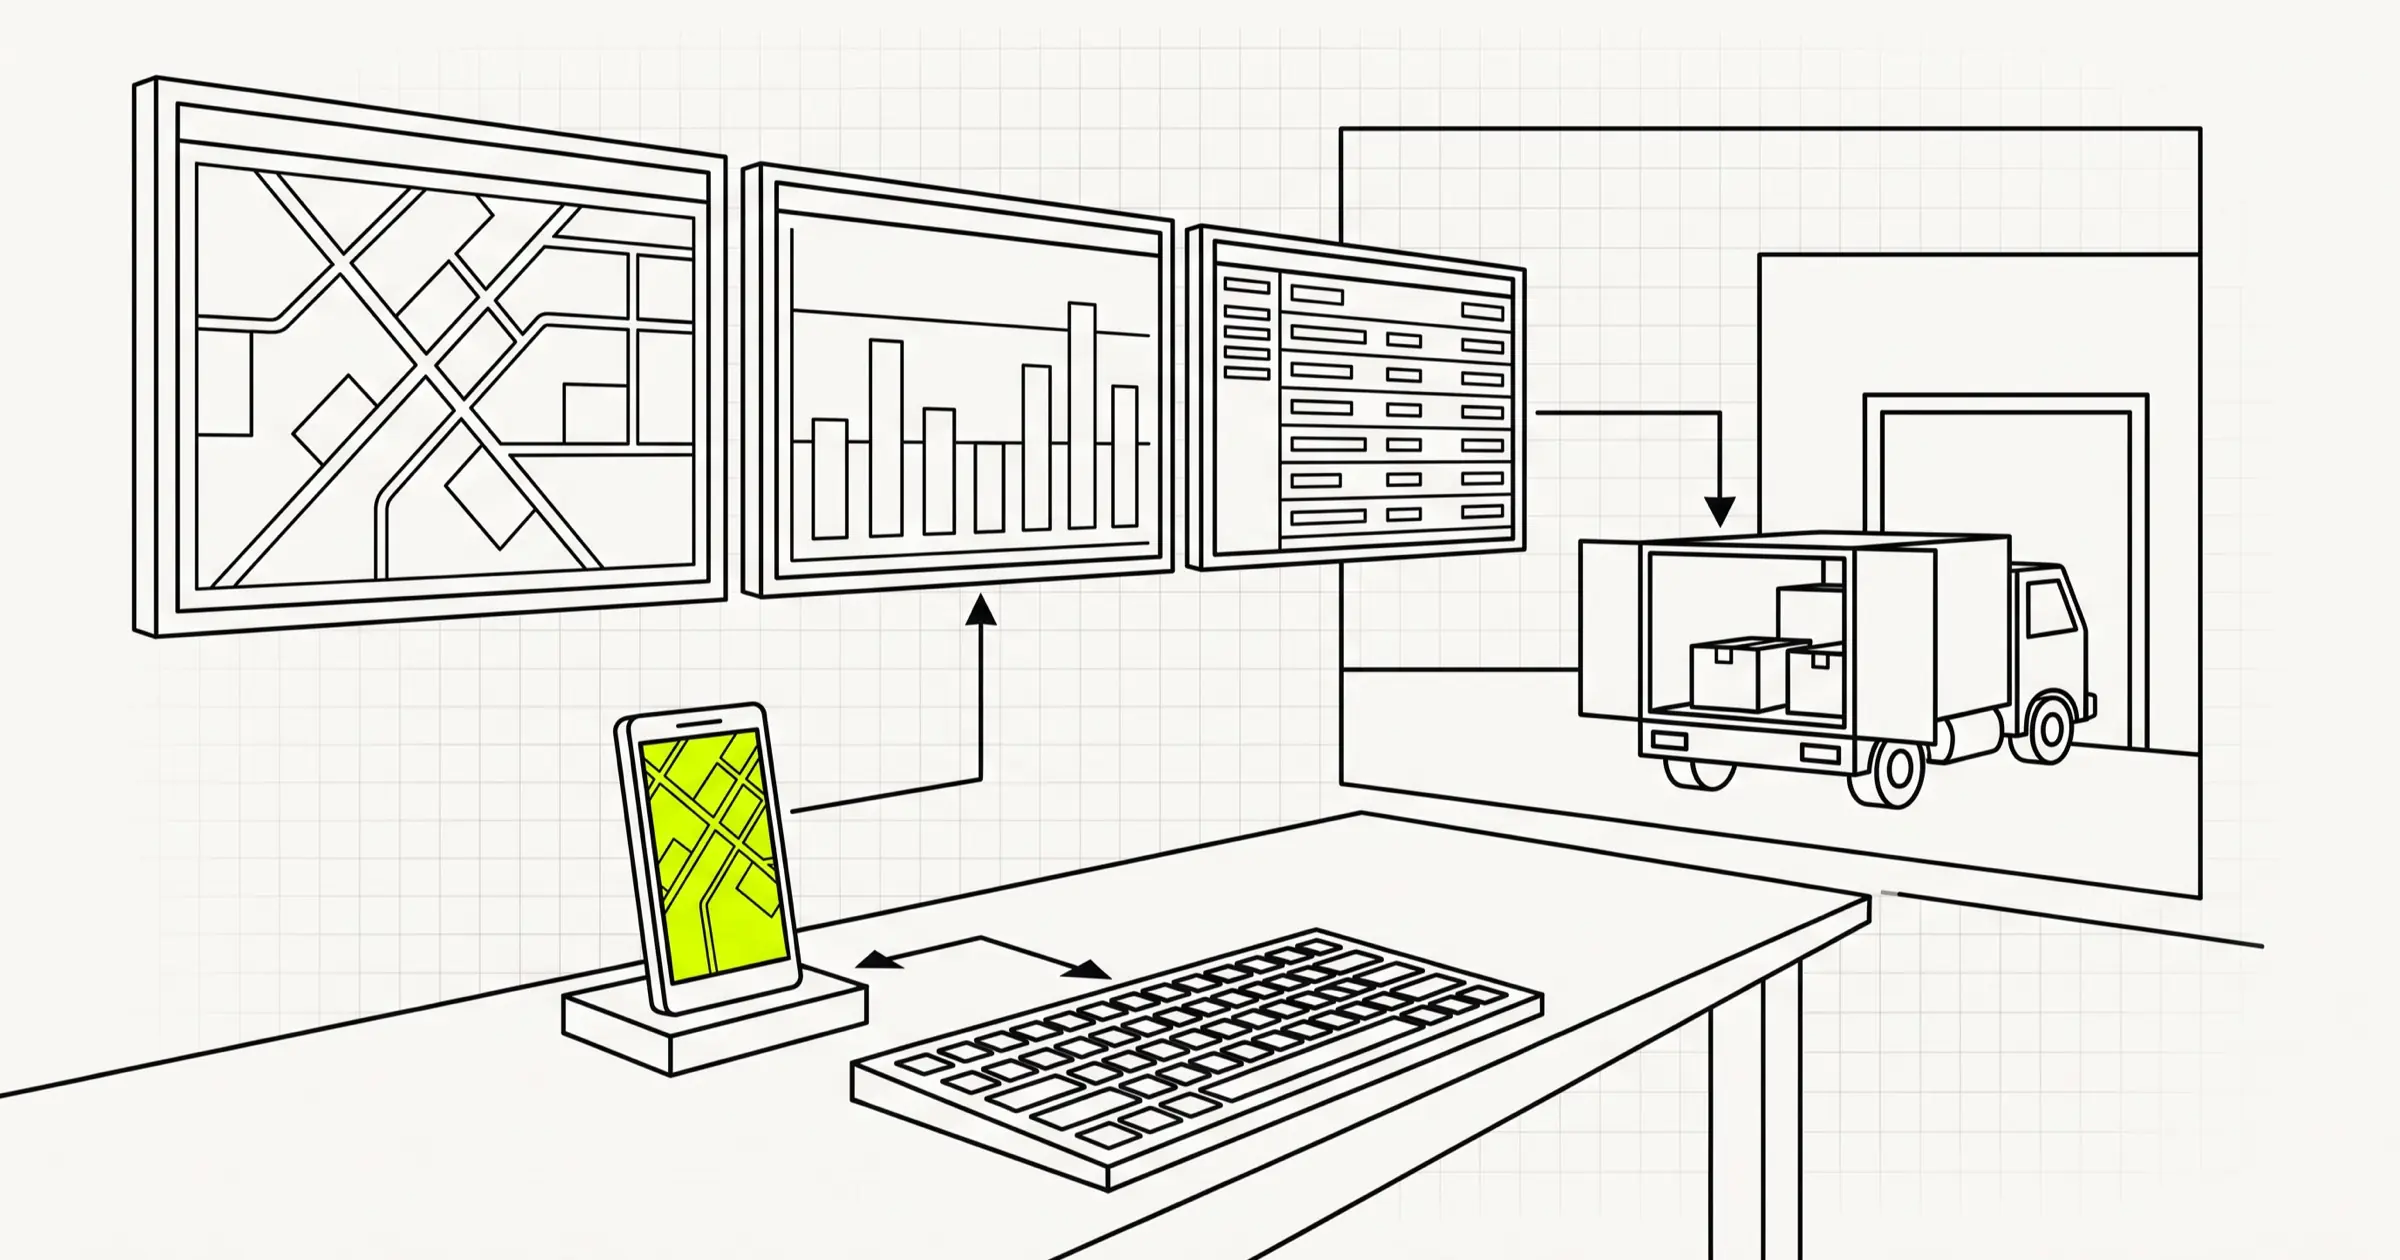
In today's fast-paced logistics industry, real-time freight tracking has become a critical component of supply chain management. Customers expect visibility into their shipments, and logistics companies need powerful tools to monitor fleets, optimize routes, and respond quickly to delays or issues. Building a robust freight tracking dashboard requires combining real-time communication capabilities with interactive mapping technologies.
This comprehensive guide explores how to build a modern freight tracking dashboard using Socket.io for bidirectional real-time communication and Mapbox GL for rendering high-performance interactive maps. Whether you're developing a new logistics platform or enhancing an existing system, this tutorial provides the technical foundation you need to create a professional-grade tracking solution.
This is the kind of system we build under logistics software development: tracking, routing, ops consoles and integrations.
Understanding the Technology Stack
Before diving into implementation, let's examine the two core technologies that power our freight tracking dashboard.
Socket.io: Real-Time Communication Engine
Socket.io is a JavaScript library that enables real-time, bidirectional communication between web clients and servers. It automatically handles connection fallbacks, supports room-based messaging, and provides excellent reliability for applications requiring constant data updates. In a freight tracking context, Socket.io serves as the backbone for transmitting vehicle positions, shipment status changes, and alert notifications in real-time.
Mapbox GL JS: Interactive Mapping
Mapbox GL JS is a JavaScript library that uses WebGL to render interactive, customizable maps at high performance. Unlike traditional slippy maps, Mapbox GL uses vector tiles, allowing for smooth zooming, rotating, and tilting while maintaining crisp text and graphics. For freight tracking dashboards, Mapbox GL provides features like custom markers, geoJSON layers, and real-time marker updates that are essential for visualizing moving vehicles.
Architecture Overview
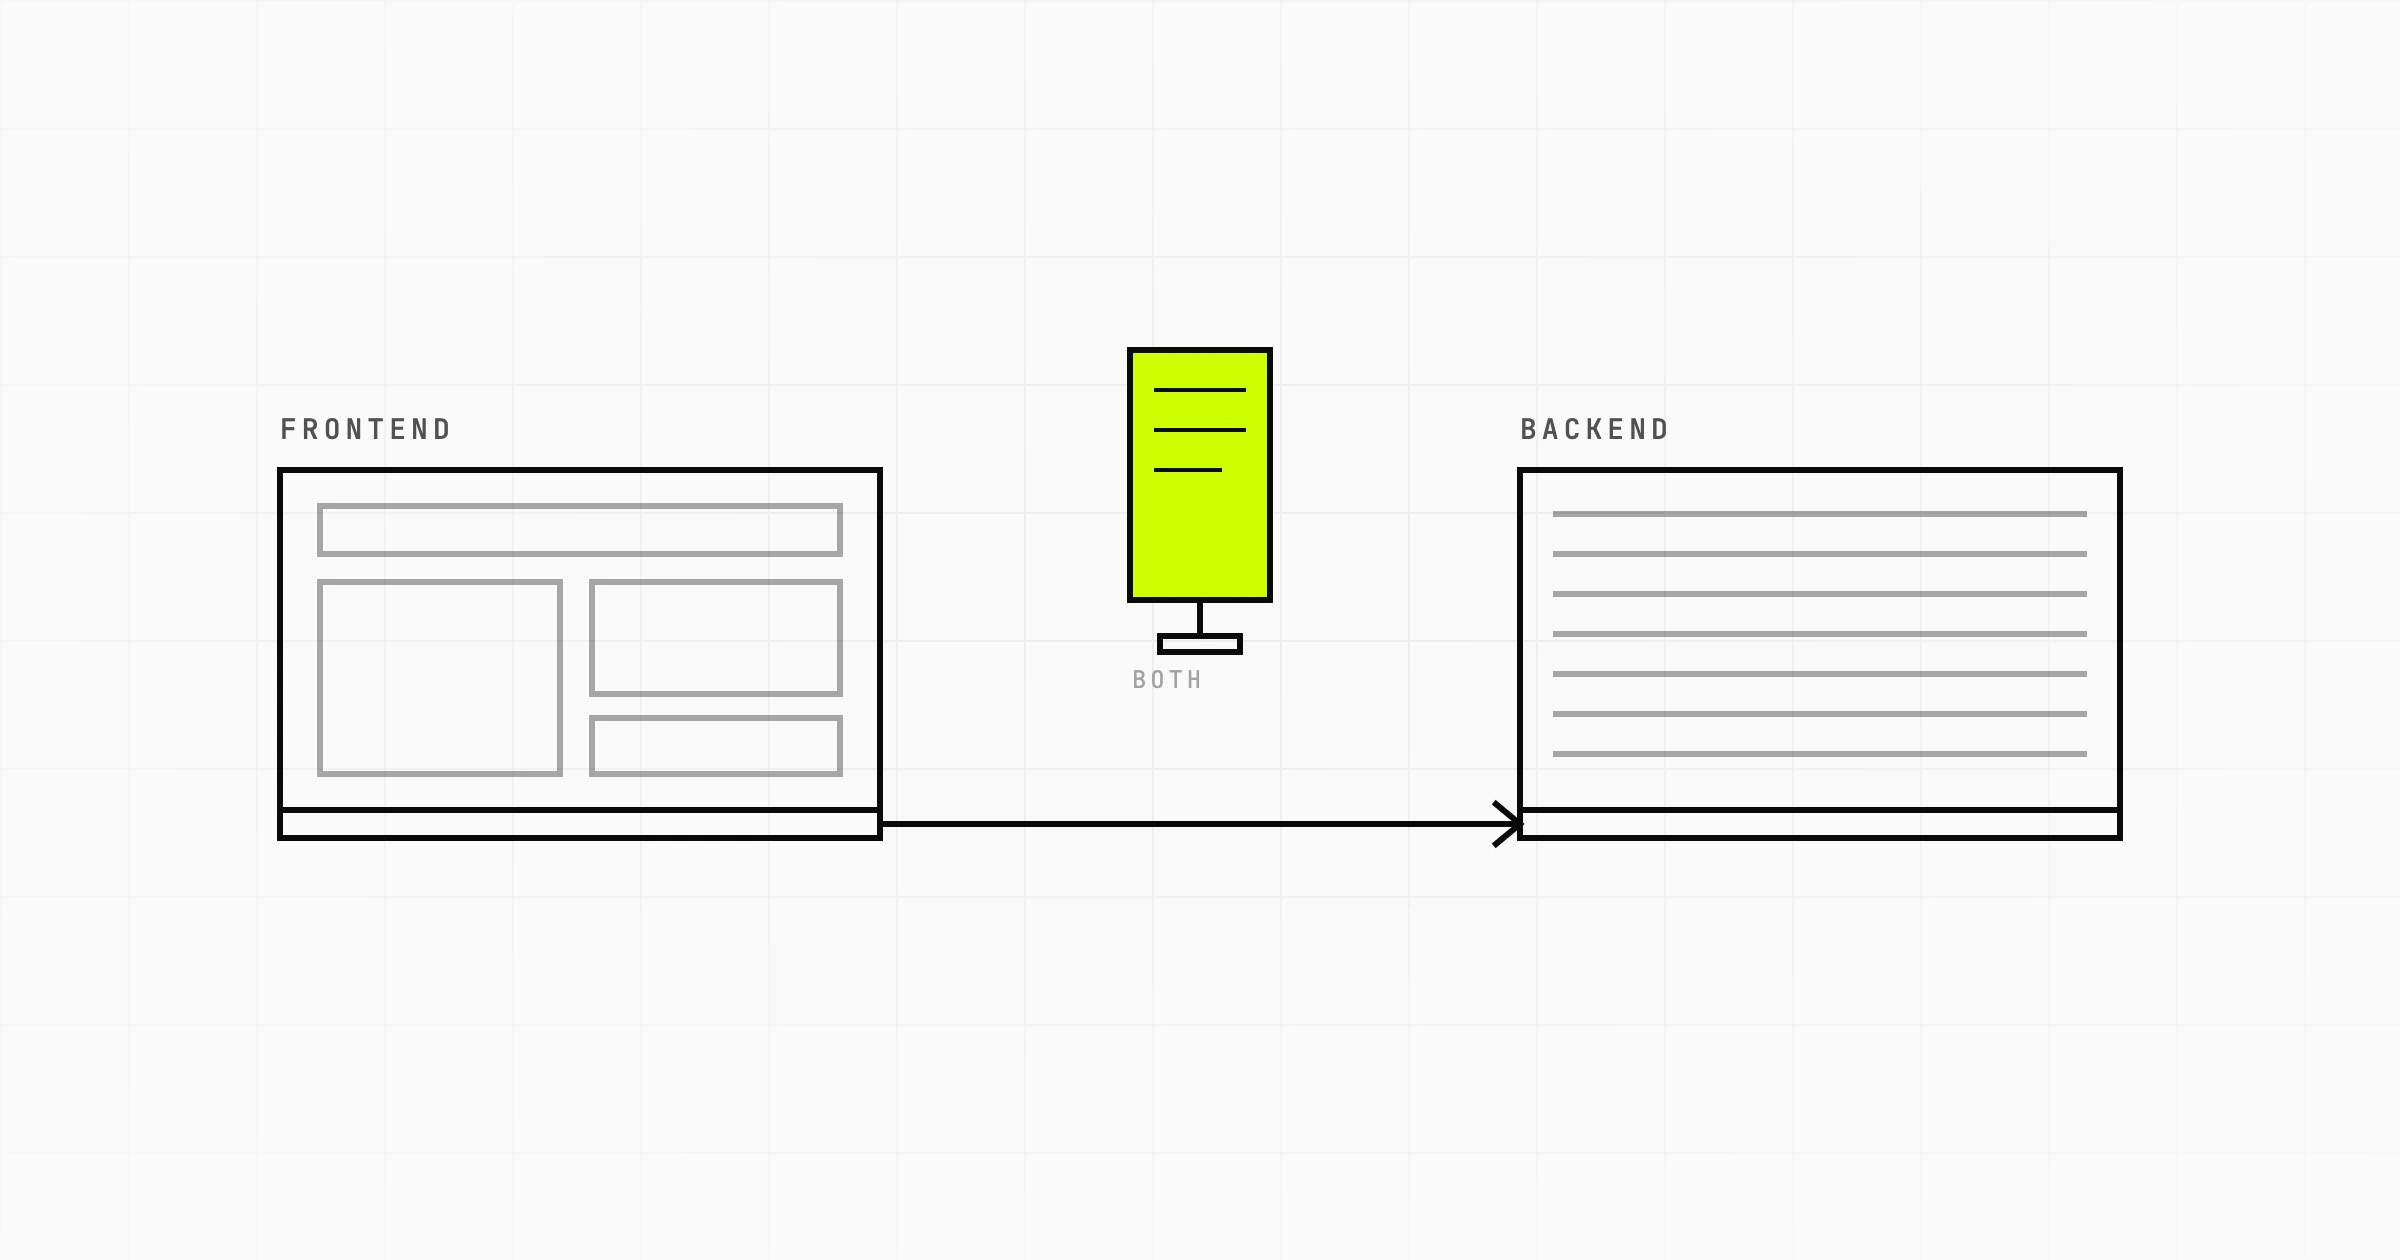
A well-designed freight tracking dashboard follows a client-server architecture optimized for real-time data flow. The system consists of three main components:
Backend Server: Handles client connections, manages vehicle data, processes GPS inputs from fleet vehicles, and broadcasts updates to connected clients. The server uses Socket.io rooms to allow clients to subscribe to specific fleet or shipment updates.
Real-Time Communication Layer: Socket.io manages the persistent connections between servers and clients. When a vehicle's position updates, the server immediately pushes this data to all relevant connected clients without requiring them to poll for updates.
Frontend Dashboard: The user interface displays the interactive map using Mapbox GL, receives real-time position updates via Socket.io, and provides controls for filtering, searching, and managing shipments.
Setting Up the Backend with Socket.io
Let's start building our freight tracking system by setting up the backend server. We'll use Node.js with Express and Socket.io.
First, install the required dependencies:
```bash npm install express socket.io cors ```
Now create the server file with the following structure:
```javascript const express = require('express'); const http = require('http'); const { Server } = require('socket.io'); const cors = require('cors'); const app = express(); app.use(cors()); const server = http.createServer(app); const io = new Server(server, { cors: { origin: "*", methods: ["GET", "POST"] } }); // Store vehicle data in memory (use a database in production) const vehicles = new Map(); // Initialize with sample vehicles vehicles.set('TRUCK-001', { id: 'TRUCK-001', lat: 40.7128, lng: -74.0060, heading: 45, speed: 65, status: 'in-transit', destination: 'Newark Distribution Center' }); io.on('connection', (socket) => { console.log('Client connected:', socket.id); // Send initial vehicle data on connection socket.emit('initial-data', Array.from(vehicles.values())); // Handle client subscription to specific vehicles socket.on('subscribe', (vehicleIds) => { vehicleIds.forEach(id => socket.join(`vehicle-${id}`)); }); socket.on('disconnect', () => { console.log('Client disconnected:', socket.id); }); }); // Simulate vehicle movement (replace with real GPS data in production) setInterval(() => { vehicles.forEach((vehicle, id) => { if (vehicle.status === 'in-transit') { // Simulate movement vehicle.lat += (Math.random() - 0.5) * 0.01; vehicle.lng += (Math.random() - 0.5) * 0.01; vehicle.speed = Math.max(30, Math.min(80, vehicle.speed + (Math.random() - 0.5) * 10)); // Broadcast update to all clients io.emit('vehicle-update', vehicle); } }); }, 3000); server.listen(3001, () => { console.log('Freight tracking server running on port 3001'); }); ```
The ops UI and APIs usually ship as web application development with real-time channels where needed.
This backend code establishes the Socket.io server, maintains vehicle state, and broadcasts position updates every three seconds. In a production environment, you would replace the simulation logic with actual GPS data incoming from fleet vehicles via MQTT, HTTP endpoints, or other protocols.
Building the Frontend with Mapbox GL
Now let's create the frontend dashboard that displays the tracking map. First, add Mapbox GL to your project:
```bash npm install mapbox-gl socket.io-client ```
Create the main application file:
```html
Implementing Advanced Features
Beyond basic tracking, a professional freight dashboard benefits from several advanced features that enhance usability and provide deeper insights.
Vehicle Trails and History
Tracking the path a vehicle has taken provides valuable context for route analysis and delay explanation. Store historical positions in your database and render them as polylines on the map:
```javascript // Add source for vehicle trail map.addSource('vehicle-trail', { type: 'geojson', data: { type: 'Feature', properties: {}, geometry: { type: 'LineString', coordinates: [] } } }); // Add layer to render trail map.addLayer({ id: 'vehicle-trail-layer', type: 'line', source: 'vehicle-trail', paint: { 'line-color': '#3bb2d0', 'line-width': 3, 'line-opacity': 0.7 } }); ```
Geofencing and Alerts
Implement geofencing to trigger alerts when vehicles enter or exit designated areas. This is essential for delivery confirmation and unauthorized route detection:
```javascript function checkGeofence(vehicle, geofences) { geofences.forEach(geofence => { const distance = getDistance( { lat: vehicle.lat, lng: vehicle.lng }, { lat: geofence.centerLat, lng: geofence.centerLng } ); if (distance < geofence.radius) { if (!vehicle.geofenceAlerts.includes(geofence.id)) { // Trigger alert socket.emit('geofence-alert', { vehicleId: vehicle.id, geofenceId: geofence.id, type: 'entered', timestamp: new Date() }); vehicle.geofenceAlerts.push(geofence.id); } } }); } ```
Cluster Analysis
When monitoring large fleets, displaying all markers simultaneously creates visual clutter. Mapbox GL supports marker clustering to group nearby vehicles:
If you're piloting one corridor or fleet first, start from a published MVP cost breakdown before a multi-site rollout.
```javascript map.addSource('vehicles-cluster', { type: 'geojson', data: vehiclesGeoJSON, cluster: true, clusterMaxZoom: 14, clusterRadius: 50 }); map.addLayer({ id: 'clusters', type: 'circle', source: 'vehicles-cluster', filter: ['has', 'point_count'], paint: { 'circle-color': ['step', ['get', 'point_count'], '#51bbd6', 10, '#f1f075', 30, '#f28cb1'], 'circle-radius': ['step', ['get', 'point_count'], 20, 10, 30, 30, 40] } }); ```
Security Considerations
When building real-time tracking systems, security must be a primary concern. Here are essential security measures to implement:
Authentication and Authorization: Implement JWT-based authentication for Socket.io connections. Validate tokens on connection and assign appropriate permissions for accessing specific fleet data.
Data Encryption: Use WSS (WebSocket Secure) connections instead of plain WS. This encrypts all data in transit, protecting sensitive location information from interception.
Rate Limiting: Implement connection rate limits to prevent abuse. Limit the frequency of position updates from individual vehicles to reasonable intervals.
Data Validation: Validate all incoming GPS data on the server side. Reject obviously invalid coordinates and sanitize any user-provided data to prevent injection attacks.
Performance Optimization
Real-time dashboards handling numerous vehicles require careful optimization to maintain smooth performance.
Delta Updates: Instead of sending complete vehicle objects on every update, implement delta updates that only transmit changed fields. This reduces bandwidth usage significantly.
Binary Data Transfer: For high-volume scenarios, consider using Socket.io's binary support to transmit position data more efficiently.
Viewport Culling: Only send vehicle updates for markers currently visible in the client's map viewport. This prevents unnecessary data transmission to clients viewing different areas.
Database Optimization: Use time-series databases like TimescaleDB or InfluxDB for storing historical position data. These databases are optimized for timestamped data and provide efficient querying capabilities.
Conclusion
Building a real-time freight tracking dashboard requires careful integration of multiple technologies. Socket.io provides the reliable, bidirectional communication channel necessary for transmitting vehicle positions instantly, while Mapbox GL delivers the high-performance mapping experience that makes that data actionable for logistics operators.
The architecture presented in this guide scales from small fleet operations to enterprise-level systems handling thousands of vehicles. By following the security best practices and optimization techniques outlined here, you can build a production-ready tracking system that delivers real value to logistics operations.
As the logistics industry continues to evolve toward greater visibility and automation, real-time tracking dashboards will become increasingly essential. The skills and patterns covered in this tutorial provide a solid foundation for building modern freight tracking solutions that meet the demands of today's supply chain operations.
Ready to ship logistics software? Run a Scoping Sprint ($2,300, two weeks) for a prototype, plan and fixed quote — or talk to us.