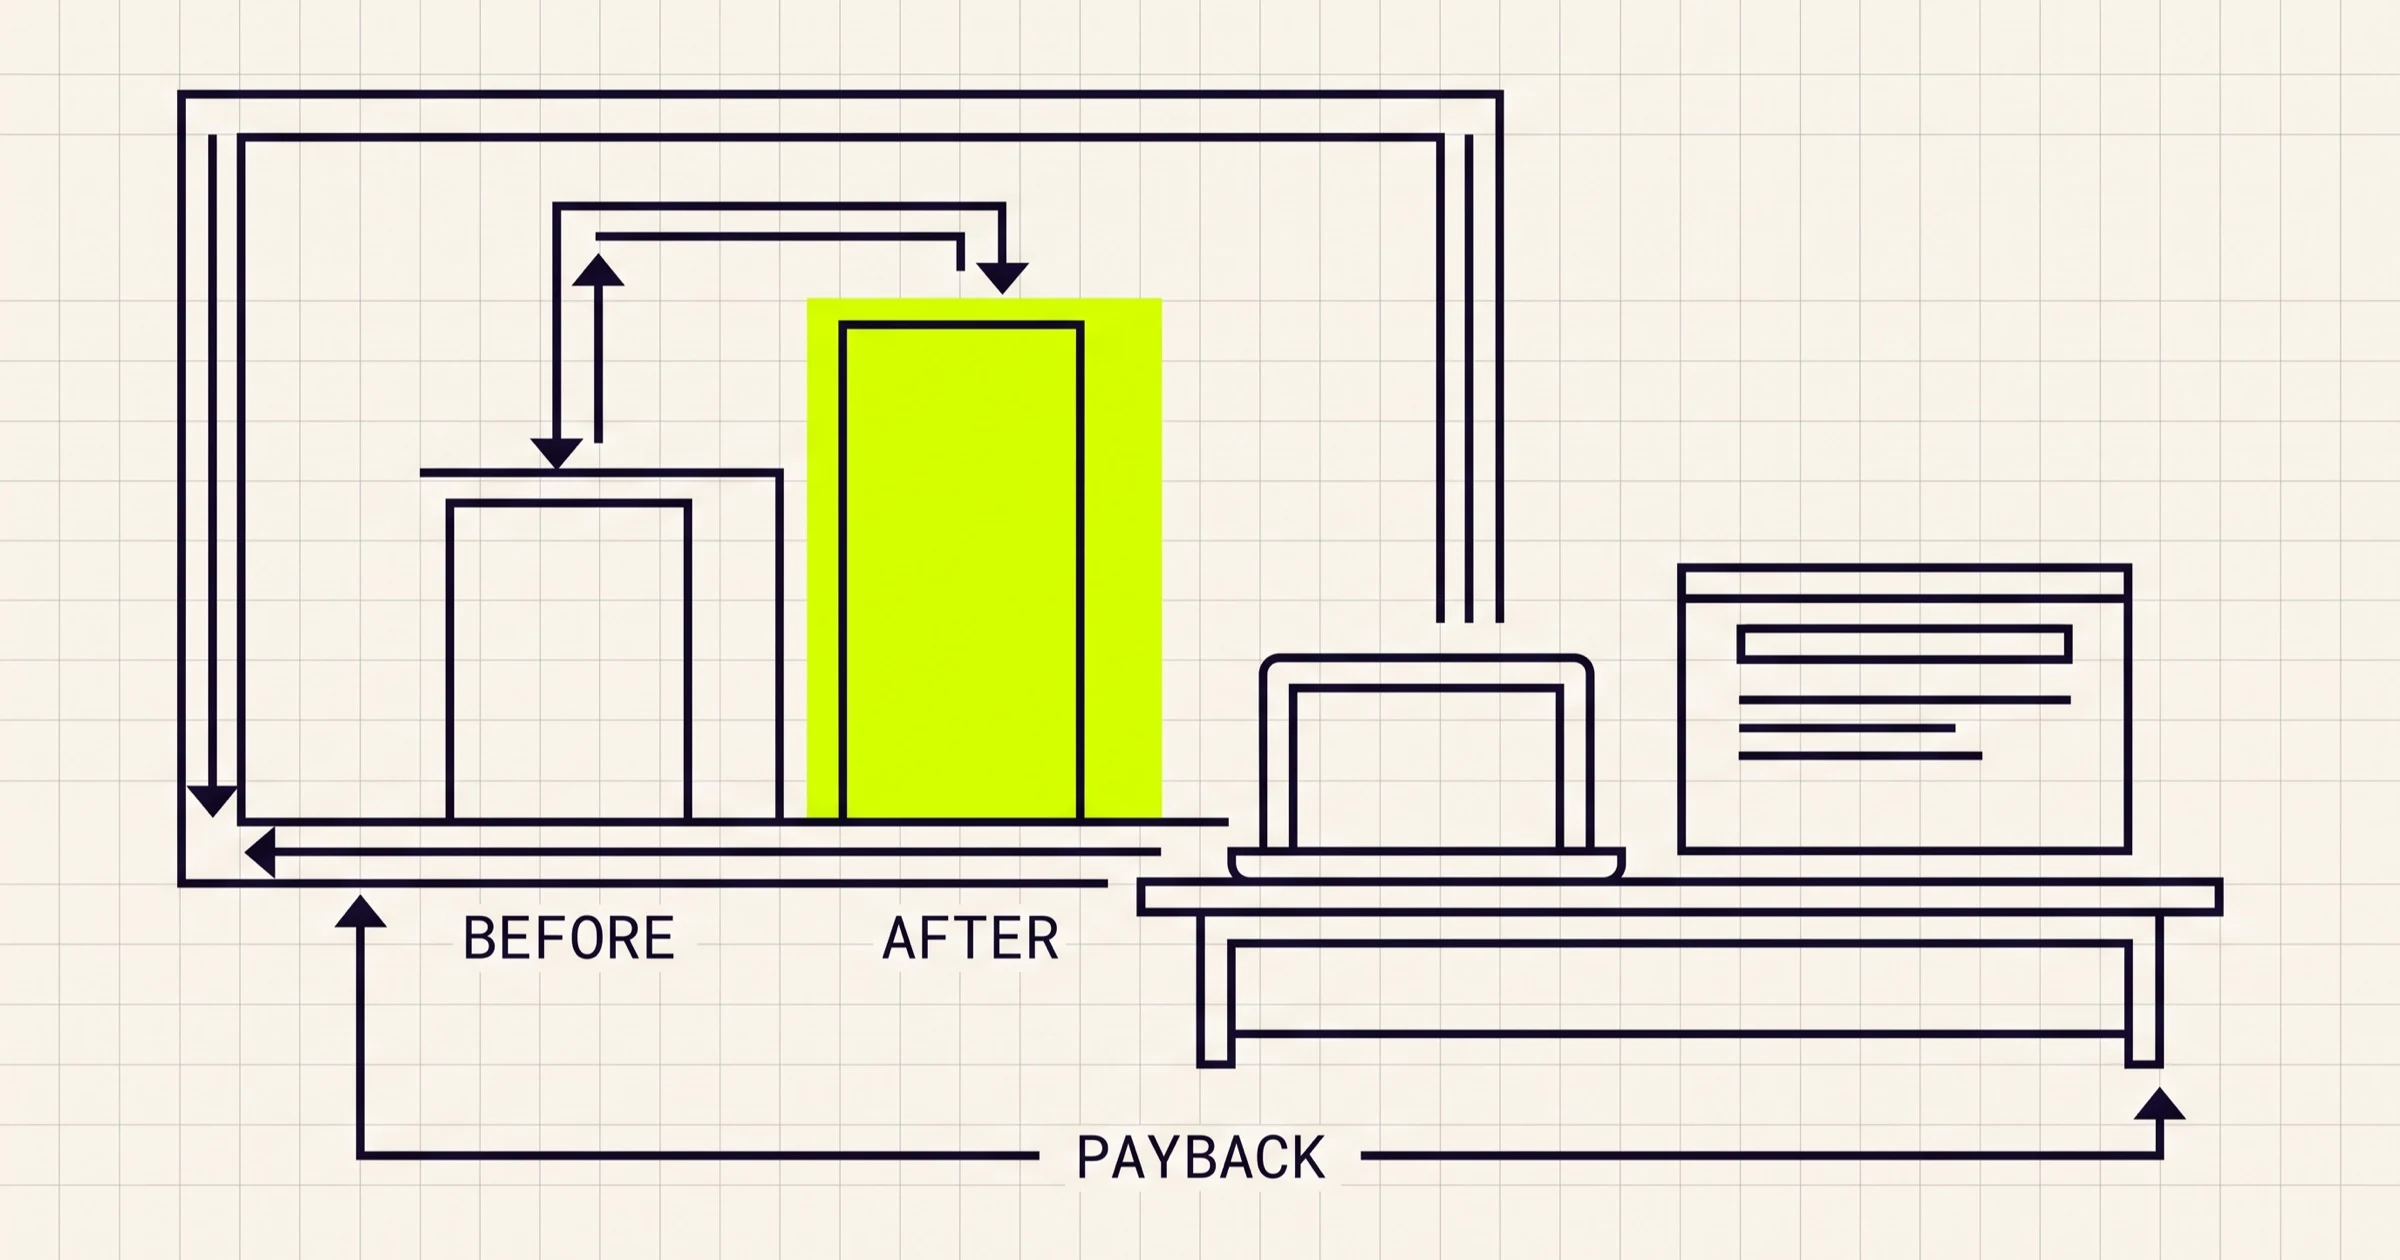
The question you will be asked is never "did the AI work". It is "what did one unit of this work cost before, what does it cost now, and how do you know it was us". Most teams running an agent or automation project cannot answer either half of that, which is why these projects get renewed on enthusiasm and cancelled at a budget review.
This is the harder half of AI measurement. Choosing sensible metrics is the easy part. Producing a number that survives a finance review, when the process was never instrumented, when four other things shipped the same quarter, and when the running cost grows with usage, is a different job.
What follows is the arithmetic and the study design in the order you have to do them: define the unit of work, take a baseline, separate real measures from theatre, cost the full running bill, attribute the change, compute a payback range, and decide what to do when the effect cannot be isolated at all. None of it needs statistics beyond arithmetic and one honest comparison group.
Start by naming the unit of work and what it costs today
Every defensible AI return calculation reduces to the same shape: cost per unit of work before, cost per unit after, multiplied by volume, minus what the system costs to run. The whole difficulty is in the first three words.
A unit of work has to be countable, atomic, and owned by someone. "A resolved support conversation." "An invoice matched to a purchase order and posted." "A claim adjudicated to a decision." "A merged pull request." If your unit is "a customer interaction" or "a productivity improvement", you do not have a unit, you have a theme, and nothing can be computed with it.
Then split the unit by difficulty before measuring anything. Almost every workflow has a fat head of routine cases and a tail of hard ones, and the tail usually carries most of the cost and nearly all of the risk. An agent that handles the head is worth having. An agent that handles the head while the dashboard reports an average is a measurement trap, because the average improves while the expensive work sits untouched.
So write down three things before the build:
- The unit. One sentence, precise enough that two people counting a week of traffic independently get the same number.
- The mix. What share of volume falls in each difficulty band, and the current cost of each band separately. Routine, exception, and escalation is usually enough resolution.
- The owner. Whose budget the current cost sits in. If nobody's budget falls when the work goes away, you are measuring a comfort improvement, which is real but is not a return.
The cost of a unit today is usually labour, and labour is knowable: who touches it, for how long, at what loaded rate, plus the rework when it comes back. Timing twenty or thirty real cases beats any survey of how long people think tasks take.
What a defensible baseline looks like, and why most teams never take one
A baseline is defensible when it has four parts: a metric definition, a window long enough to cover a full business cycle, the population it covers, and the natural swing in the number when nothing changes. The last part gets skipped and it decides whether your result is readable at all. If handling time already moves 15 percent month to month, a 10 percent improvement is invisible.
Very few teams take one. The reasons are structural, not lazy:
- The build was approved on a demo. The decision is already made, so instrumentation reads as delay rather than as part of the project.
- Nobody owns the process end to end. The work crosses three teams and each sees only its own segment, so there is no single number to record.
- The baseline is politically risky. Measuring properly sometimes shows the manual process is cheaper than the story used to justify the project, or that the bottleneck is elsewhere. That result is valuable and unwelcome.
- Everyone assumes the logs will do. They rarely do, because production systems log what engineers needed for debugging, not what an evaluation needs for comparison.
Past the point of a clean baseline, there are three honest options. Delay the rollout two to four weeks and measure now, which beats a year of unresolvable argument. Reconstruct from systems that were logging anyway, such as ticket timestamps, ERP audit trails or version control history, accepting looser definitions. Or hold part of the population back and manufacture a comparison in the present instead of the past. What is not an option is a staff estimate written up as a measurement. "The team reckons this saves an hour a day" is a hypothesis.
Which numbers are real and which are theatre
The test is simple. A real measure moves only if the work actually changed. A theatre measure can move while the work stays exactly the same, and most of the numbers in circulation around agent projects are theatre.
| Commonly reported | Why it moves without the work changing | Measure this instead |
|---|---|---|
| Tokens or hours "saved" | Computed by multiplying an assumed per task saving by volume. It is an input to a claim, not an observation. | Observed cycle time per unit, measured the same way before and after |
| Prompts written, workflows built, agents deployed | Counts activity inside the project, which rises simply because the project exists | Share of total volume the system completed end to end with no human edit |
| Seats or licences deployed | Procurement, not usage, and certainly not outcome | Weekly active use per licence next to an outcome number for the same team |
| Model accuracy on an evaluation set | An engineering diagnostic on data you already hold. It improves while every output is still reviewed by the same person as before. | Human override and edit rate in production |
| First touch deflection or containment | Counts the case as handled at the moment of contact, before you know whether it came back | Full resolution with no repeat contact inside a fixed window, usually seven to fourteen days |
| Average handling time across all cases | Weighted by the easy majority, so it improves when the easy cases get automated and the hard ones do not | Handling time and cost split by difficulty band, reported with coverage |
Four measures carry most of the weight across nearly every workflow: cycle time per unit from arrival to done, fully loaded cost per handled case, error and rework rate including anything a customer had to chase, and throughput per person on the team doing the work. Report those four split by difficulty band and next to coverage and you have a measurement system.
Coverage is the part to insist on. Always state what fraction of total volume the system attempted and what happened to the remainder. Quality figures computed only over cases an agent chose to act on look excellent forever, because the system declines the hard ones and the dashboard never sees them. That is the most common way an honest team fools itself.
How to measure the ROI of AI tools in software development
Developer tooling is where measurement goes wrong most confidently, because the vendor supplies a metric that sounds like output and is not. Suggestion acceptance rate tells you a developer pressed tab. It says nothing about whether the change shipped, whether it came back as a defect, or whether review took longer because the diff was larger than a human would have written.
Measure the delivery pipeline instead, which most teams already instrument:
- Cycle time from first commit to merge, and separately the time a change waits in review. Assistants tend to move work faster into review and slower through it. Reporting only the first half gives a flattering and wrong answer.
- Change failure rate and time to restore. If more code ships and more of it gets reverted, you moved cost from writing to firefighting.
- Rework, as lines or files touched again shortly after merge. The earliest honest signal that speed is being borrowed rather than earned.
- Review burden, in reviewer hours per merged change. This is the cost that quietly absorbs the gain, and it lands on your most senior people.
- Throughput on a stable unit, such as comparable-sized tickets per engineer per sprint. Crude, still better than acceptance rate.
Compare across teams rather than across time. Give the tool to half the squads for a quarter and leave the rest alone, because composition and project difficulty vary so much that a before and after on one team tells you almost nothing.
AI testing ROI
Test generation is easy to justify badly, because the obvious metric is test count or coverage percentage and both rise while nothing gets safer. The return shows up in three places: escaped defects reaching production per release, suite maintenance hours per month, and flake rate, since a suite that fails intermittently turns into ignored alerts and negative value. A large generated suite that lifts maintenance hours and flakiness while escaped defects stay flat has a negative return, and coverage percentage hides that completely.
Metrics to measure low code ROI
Low code and internal agent platforms need a different denominator, because the cost moves rather than disappearing. Useful measures: cost per delivered screen or workflow against what the same thing costs in your normal stack, share of requests fulfilled without the central engineering team, which is the actual promise being sold, time from request to something in use, and the count of workflows that later had to be rebuilt properly. The last one is the real question and it only appears in year two. Budget for rebuilding the handful that outgrow the platform, and count it against the original saving, because it is the same money.
Build the cost side line by line
The benefit side gets argued over. The cost side gets one row labelled "development" and a nod. That is where the return usually goes, because a model backed feature does not behave like conventional software. Traditional features cost a fixed amount to build and close to nothing per additional use. Agents cost money every time they run, so success makes the bill grow, and a pilot that looks cheap can be unaffordable at full volume.
| Cost line | How to estimate it | What teams get wrong |
|---|---|---|
| Inference and tool calls | Measured cost per completed unit at pilot, times the volume you expect if it works | Pricing the happy path. Retries, failed attempts, long contexts and multi step loops can cost several times a successful single pass. |
| Human review in the loop | Reviewer minutes per unit times loaded rate, sampled from real observation | Treated as pre-existing overhead. If the design needs a reviewer, that reviewer is part of the running cost. |
| Evaluation and data work | Hours to build the first evaluation set, plus recurring hours to keep it representative | Assuming the evaluation set is a one time artefact. It goes stale as fast as your traffic changes. |
| Monitoring and logging | Build effort plus storage, treated as a feature of its own | Cut first, regretted first. It never gets built after launch, because after launch there is no budget line for it. |
| Forced migration | A recurring yearly allowance, not a one off | Ignored entirely. Providers deprecate versions and change default behaviour, and prompts tuned against the old behaviour need re-testing. |
| Exception handling | Cost of cases the agent could not finish, often higher per case than before | Counting only what the agent completed. A half handled case picked up cold can cost more than one a person owned throughout. |
On maintenance, the planning figure we publish comes from running our own software rather than from a survey. Denti360, our dental practice management product, takes ongoing engineering of 15 to 20 percent of the original build cost per year to keep it current, before any new features. That is a conventional web application with no model in it, so read it as a floor. Evaluation upkeep, provider migrations and prompt regressions push a model backed system above that band, not below it. Any calculation that sets a one time build cost against a recurring benefit is not a calculation.
Add one line that rarely appears: the cost of being wrong. An agent that acts on the world, refunding, ordering, scheduling or messaging a customer, has a per incident cost when it acts incorrectly, which you can estimate from error rate times blast radius. Where a single bad action is expensive, the workflow needs a tighter human gate, and the cost of that gate belongs in the denominator. That trade is worth settling early when scoping AI and agentic development, because it decides the architecture as much as the budget.
Attribution when several things changed at the same time
A before and after chart is not evidence. In the same window you probably also changed staffing, hit a different season, shipped two other releases, and paid closer attention to a process because it was being watched. Any of those can produce the movement you are about to credit to the agent.
In descending order of strength:
- Randomised holdout. Assign cases, accounts or users to the system or not, and compare. The only design that survives a hostile question. The usual objection is that withholding a good tool is unfair, which is only a real objection once you know the tool is good, which is the thing you are trying to establish. Ten to twenty percent held back for a quarter is normally acceptable once framed that way. In lending, claims or anything else regulated, clear the design with whoever owns that risk first.
- Staggered rollout by unit. Switch one branch, region or team at a time and compare switched against not yet switched in the same period. Weaker, because units differ, but it removes the seasonality and company wide event problems, and staged rollout is how you would ship anyway.
- Interrupted time series. With a long clean history, model the pre-launch trend and test whether level or slope changed at launch beyond the normal swing. Report it with its uncertainty attached, not as a point estimate.
When nothing can be held back, the minimum discipline is a dated change log for the process, not just the codebase: every change that could plausibly move the metric, including staffing, pricing, policy and upstream systems. Then space your own releases far enough apart to be readable. Shipping the agent, a new queue policy and a reorganisation in the same fortnight guarantees nobody will ever know which one worked, and that cost is self inflicted. Sequencing releases so each can be read belongs in the delivery plan from the start of end to end product development, not in the evaluation afterwards.
Payback period, and the number you actually present
Do not present a single ROI percentage. Present a payback period as a range with the assumption that drives it, because that is the form the decision gets made in and it puts the sensitivity on the table instead of hiding it.
The arithmetic, as a shape rather than a result from anywhere: monthly volume times the observed saving per unit gives gross monthly benefit. Subtract monthly running cost, which is inference plus review time plus the maintenance allowance spread over twelve months. What is left is net monthly benefit, and build cost divided by that is payback in months. Run it three times: today's volume with the pessimistic saving, expected volume and saving, and full rollout volume with inference re-priced at the higher usage rather than the pilot's unit cost.
Two things fall out reliably. First, the break-even volume below which the system loses money, which is more useful to a sponsor than any percentage because it turns the decision into a question about demand. Second, which scenario rests on an assumption you have not actually measured, which tells you what the pilot should measure next.
Hold a model backed system to a shorter payback than a conventional feature. A web application keeps working untouched for years. An agent sits on a dependency that moves underneath it, so a payback longer than the interval between provider changes is a bet that the system keeps earning through a rebuild you have not scoped. Under a year is comfortable. Two years and up needs a specific argument about why this workflow is stable.
Then design the pilot so it can be read. One unit of work, one team, long enough to cover a full business cycle rather than two weeks, with a comparison group kept aside. Decide up front which two numbers you will look at and what result switches it off, and write that sentence down while nobody is invested in the answer. A shadow mode period, where the agent runs and its output is logged but not used, buys quality evidence at no operational risk. Pilots without a written kill criterion do not end. They become a line item everyone assumes somebody else validated.
When the return cannot be measured cleanly
For a lot of AI work the effect genuinely cannot be isolated, and pretending otherwise produces fiction that costs more than the feature did. The honest cases: the effect is smaller than the natural swing in the metric; volume is too low for any comparison to resolve in a reasonable window; the benefit is defensive, meaning you keep customers you would otherwise have lost, which you cannot observe; or the value sits in a decision taken a handful of times a year, where quality matters and sample size will never exist.
The answer is not a more elaborate attribution model. Switch to one of these:
- Set a cost ceiling instead of a return target. Decide what the capability is worth per month as a standing cost, cap the spend there, and watch the cap. Plenty of things are bought this way and it is more honest than an invented return.
- Track the leading indicators you can see. Override rate, coverage, rework and escalation rate are all observable at low volume and all move before the outcome does. They will not give you a currency figure, and they will tell you whether the thing is working.
- Buy optionality deliberately. Some builds are paid for by what you learn about your own data and process. A legitimate reason to spend, as long as it is written down as the reason, with a budget and an end date, and is not later reported as a cost saving.
- Keep it reversible. When you cannot measure, being able to switch it off cheaply is worth more. Avoid designs that require rewriting the surrounding workflow, because those cannot be unwound.
Retail merchandising and search have the opposite problem, plenty of traffic and plenty of confounders, so the constraint is isolating one change rather than gathering enough data. Teams working on retail and ecommerce systems usually have the volume to randomise properly and should, since it is the one setting where the strongest design is also the easiest to run.
The teams that get the most out of this spending do not have the most detailed measurement framework. They name a unit of work, record what it costs before they build, count the running cost honestly including the humans still in the loop, hold something back so the comparison means something, and switch off what did not pay. The last habit is worth more than all the metrics.
Trying to work out whether an agent or automation project can be justified with numbers before you commit the budget? A Scoping Sprint ($2,300, two weeks) ends with a baseline and measurement plan defined for your specific workflow, a prototype, and a fixed quote. Or just start a conversation.