Most AI ROI reporting measures the model, not the business. A system can get measurably more accurate while the cost line, the headcount and the revenue stay exactly where they were.
Accuracy, precision, recall and F1 are engineering diagnostics. They tell you whether the thing you built behaves the way you designed it on data you already have. They tell you close to nothing about whether the money came back. The gap between those two questions is where almost every disappointing AI project lives.
The failure has a specific shape. A team ships a classifier that moves from 82 percent to 91 percent on the held-out set. The evaluation dashboard goes green and the launch is called a success. Two quarters later, finance asks which cost line changed and nobody can answer, because every prediction the model makes is still reviewed by a person who was already catching those errors by hand. The model got better. The work did not get smaller.
So the useful version of "how do we measure AI success" is not a list of KPIs. It is a sequence of questions asked in order: what was true before, what changed, how do you know the change was you, what does it really cost to keep running, and is it still true a year later. Each one is easy to answer in a way that flatters the project.
Why an accurate model can still be a bad investment
A model improvement only reaches the business through a decision that changes. If the workflow around the model absorbs the improvement, the improvement is invisible in every metric anyone outside the engineering team cares about.
Three common ways that absorption happens:
- The human review step never changes. If a reviewer checks 100 percent of outputs before and after, a better model shortens each review slightly and removes no headcount. You bought a small comfort improvement at the price of a build.
- The bottleneck was somewhere else. A support triage model that routes tickets perfectly does not help if the queue is slow because there are not enough agents on the afternoon shift. You optimised a step that was not the constraint.
- The accuracy gain lands on cases that do not matter. Aggregate accuracy is a weighted average over your test distribution. Most of the gain is usually on the easy, high-volume, low-value cases, because that is what the loss function rewards. The expensive cases are the tail, and the tail moved less than the headline number suggests.
The practical fix is to write down, before you build, the exact decision or action that will be different once the system exists, and who will take it. If you cannot name that decision, you do not have a measurable project. You have a demo.
Fix the baseline before you build anything
You cannot compute a return against a number you never recorded. This is the single most common reason AI ROI reporting turns into an argument rather than a calculation, and it is entirely preventable at the cost of two or three weeks of instrumentation before the build starts.
A usable baseline needs four things: the metric defined in one sentence that two people would compute identically, the measurement period, the population it covers, and the natural variance. That last one gets skipped constantly. If your monthly manual-review hours already swing 15 percent for reasons nobody controls, a 10 percent improvement is not detectable, no matter how confidently the slide says otherwise.
When nobody measured the before state
This is the normal situation, not the exception. You are asked to prove the value of something already half-built, in a process that was never instrumented. Three honest options, in order of preference:
- Delay the rollout and measure now. Two to four weeks of clean baseline data before you switch anything on is almost always cheaper than a year of unresolvable argument. If the system is built and waiting, that wait is annoying and correct.
- Reconstruct from a system that was already logging. Ticket systems, ERP timestamps, payroll, call records and git history all record process facts nobody set out to collect. Reconstruction is weaker than a designed baseline because the definitions will not match cleanly, but it is real evidence.
- Hold part of the population back. If you cannot measure the past, manufacture a present comparison instead. Ship to one region, one team or one product category and keep the rest as it was. This is usually better than any historical baseline anyway, and it is covered below.
What is not an option is a time-boxed guess presented as a measurement. "Staff estimate this saves them about an hour a day" is a hypothesis worth testing, not a number worth putting in a business case.
The three layers of measurement, and how they connect
Measurement fails when one layer is reported as if it were another. Keep them separate and state the link between them explicitly, because the link is a claim that can be wrong.
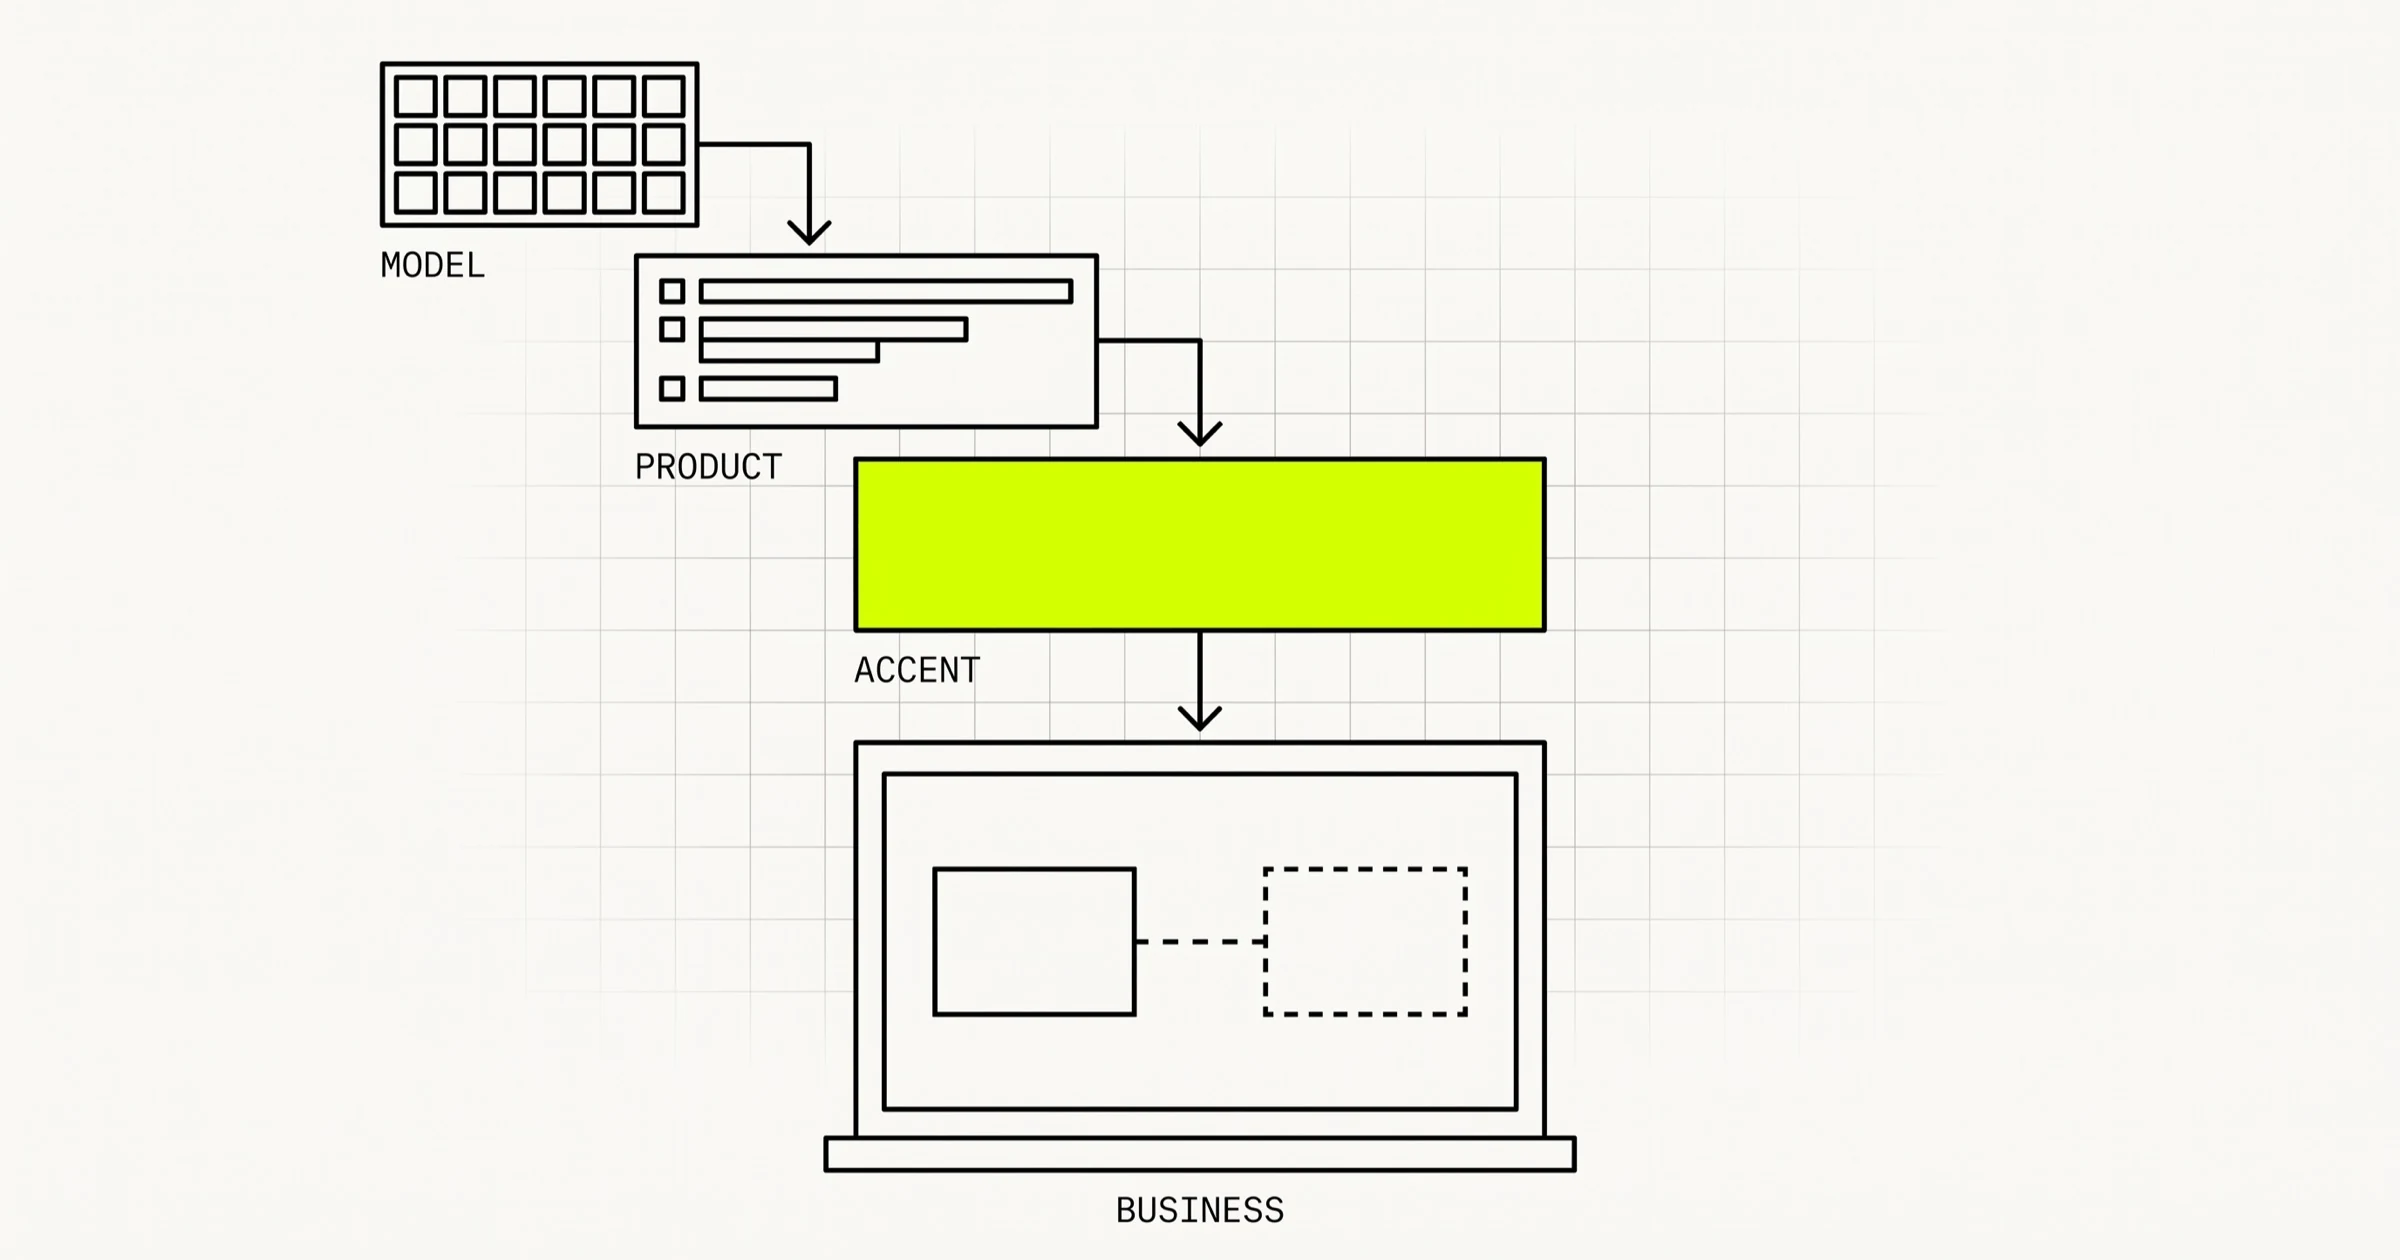
Layer one is model quality: does the system produce correct output. Layer two is workflow effect: does the work actually happen differently now. Layer three is business outcome: did a number the company already tracks move. Layer one only reaches layer three through layer two, and layer two is the layer nobody instruments.
| Layer | Example metrics | Who cares, and what they do with it |
|---|---|---|
| Model quality | Precision and recall at the operating threshold, error rate on the expensive-case slice, calibration, latency at p95, refusal or fallback rate, hallucination rate on a fixed evaluation set | The engineering team. Decides whether to retrain, change the threshold, change the prompt or model, or add a retrieval step. Never a board metric. |
| Workflow effect | Share of cases resolved without human touch, average handling time, rework and reopen rate, override rate (how often people reject the system's output), queue depth, time to first response | Operations and the team leads. Decides whether the process design is right and whether people trust the system enough to use it as intended. |
| Business outcome | Cost per unit of work, headcount or contractor spend, revenue per customer, conversion rate, loss or write-off rate, churn, capacity served without new hires | Finance and the executive sponsor. Decides whether to fund the next phase, expand it, or stop. |
The override rate in the middle row deserves special attention. It is the cheapest early warning signal you can build and almost nobody logs it. If reviewers reject or edit the system's output most of the time, no amount of offline accuracy matters, and you will find out from the outcome layer six months later instead of from the workflow layer next week.
How to attribute the change honestly
A before-and-after chart is not evidence. Between "before" and "after" you also changed the team, hit a different season, ran a pricing change, and probably paid more attention to the process simply because it was being watched. Any of those can produce the movement you are about to attribute to the model.
Three attribution methods, in descending order of strength and ascending order of convenience:
Holdout
Randomly assign cases, users or accounts to receive the system or not, and compare. This is the only method that survives a hostile question. It is often refused on the grounds that withholding a good tool is unfair, which is only a real objection once you know the tool is good, which is the thing you are trying to find out. A holdout of 10 to 20 percent for one quarter is usually acceptable to everyone once framed that way.
Staged rollout by unit
Turn it on for one branch, region or team at a time and compare the switched units against the not-yet-switched ones in the same period. Weaker than randomisation because units differ, but it removes the seasonality and company-wide-event problems that destroy naive before-and-after comparisons, and it is operationally easy to justify because staged rollouts are how you would ship anyway.
Interrupted time series
When you have a long, clean history of the metric, model the pre-launch trend and test whether the level or slope changed at the launch date beyond normal variation. It needs enough history to establish the trend and a launch date sharp enough to count as a real interruption. It is the fallback when you truly cannot hold anything back, and it should be reported with its uncertainty attached, not as a point estimate.
In regulated settings, holdouts need more care. A lending or claims workflow where two applicants get materially different treatment by random assignment is a compliance question as much as an experimental one, so run the design past whoever owns that risk first. On a fintech platform this is worth settling during design rather than at evaluation time.
The cost side is where most AI ROI calculations cheat
The numerator gets scrutinised. The denominator gets a single line labelled "development cost" and everybody moves on. The denominator is usually where the return actually goes.
- Inference and token spend, which scales with usage. This is the structural difference from conventional software. Traditional features cost a fixed amount to build and near zero per additional use. Model-backed features cost per call, and success makes the bill grow. A feature that is profitable at pilot volume can be unprofitable at full rollout, and the pilot will not tell you, because the pilot is small. Model the per-unit cost at the volume you expect if it works, not the volume you have.
- Human review time. If the design keeps a person in the loop, their time is part of the running cost of the system, not an overhead the system inherited. Count it.
- Data work. Labelling, cleaning, building and maintaining the evaluation set, and the ongoing curation that keeps the evaluation set representative. The evaluation set is not a one-time artefact. It goes stale exactly as fast as your traffic changes.
- Monitoring and evaluation infrastructure. Logging inputs and outputs, running periodic evaluations, alerting on quality regressions. This is a real system with real maintenance, and it is the part teams cut first and regret first.
- Maintenance drag. The line that never appears in the business case.
On that last one, the planning figure we publish comes from operating our own software: for Denti360, the dental practice management product we run, ongoing engineering costs 15 to 20 percent of the original build cost per year to keep it current, before any new features. That is a conventional web application with no model in it, so treat it as a floor. A model-backed feature adds evaluation maintenance, forced migrations when a vendor deprecates a version, and retraining, which puts the drag above that band rather than below it. If your ROI calculation compares a one-time build cost against a recurring benefit, it is not a calculation, it is a sales document.
The system that was worth it at launch and is not worth it now
AI systems decay in a way that ordinary software does not. Ordinary code that is not touched keeps doing exactly what it did. A model that is not touched keeps doing what it did while the world moves away from it.
Four distinct decay modes, and they need different responses:
- Input drift. The data coming in stops looking like the data you trained or tested on. New product categories, a new customer segment, a changed upstream form. Detectable without any labels by watching the input distribution.
- Concept drift. The relationship changes even though the inputs look similar. Fraud patterns adapt because adversaries adapt. Buying behaviour changes. Needs labels, which is why it is caught late.
- Dependency drift. Your model provider deprecates a version, changes default behaviour, or silently updates. Your prompts were tuned against behaviour that no longer exists. Pin versions, keep a regression suite, and budget for forced migrations.
- Process drift. The humans quietly stop using it as designed. They batch the work and review everything at the end of the week, or they route around the system for the hard cases. The system looks fine. The workflow layer has silently reverted.
The countermeasure is unglamorous: a fixed evaluation set that you rerun on a schedule, input distribution monitoring, an override-rate chart someone actually looks at, and a scheduled re-examination of the business case at six or twelve months. Build the monitoring at the same time as the feature. It never gets built afterwards, because afterwards there is no budget line for it. This is a large part of what a serious AI and agentic development engagement should include from the start.
Metrics that look good and mean nothing
These are the four that show up most often in AI ROI decks, all of which can be high while the return is zero.
Adoption without outcome
Weekly active users of the AI feature, queries per user, percentage of staff who have tried it. Usage is a precondition for value, not evidence of it. People use things that are mildly interesting and abandon them in month three. Adoption is only meaningful when reported next to an outcome number, and if the outcome number does not exist yet, adoption is measuring curiosity.
Time saved that never converts
The classic calculation multiplies minutes saved per task by tasks per month by a loaded hourly rate and produces a large number. That number is real only if the freed time becomes fewer paid hours or more output. If a team of ten saves six minutes each per day and still works the same hours at the same volume, the saving is comfort. That is a real benefit for morale and retention and it is not a cost saving. Say which one you are claiming.
Deflection that just relocates the work
A support assistant reports that it handled 40 percent of conversations. Check what happened next. If a meaningful share of those users came back through another channel, escalated later with a more complicated problem, or churned quietly, the work was moved and possibly made more expensive. The honest metric is full resolution without any subsequent contact within a fixed window, not first-touch deflection.
Dashboards built only on handled cases
The most subtle one. If your quality metrics are computed over the cases the system chose to act on, and the system declines or falls back on the hard ones, your dashboard measures the easy subset and will look excellent forever. Always report coverage next to quality: what fraction of total volume the system attempted, and what happened to the remainder. A retail search or recommendation system that abstains on unfamiliar queries will show strong relevance scores while quietly failing the long tail, which is why teams working on retail and ecommerce systems should segment by query frequency before believing an aggregate number.
Sometimes the honest answer is that you cannot measure it
For a lot of AI features, the ROI is genuinely not measurable at the feature level, and pretending otherwise produces fiction that costs more than the feature did.
This is true when the effect is smaller than the natural noise in the business metric, when the feature is one of twenty changes shipping the same quarter, when the benefit is defensive (you keep customers you would otherwise have lost, which you cannot observe), or when volume is too low for any comparison to reach significance in a reasonable window.
In those cases the correct decision is not a more elaborate attribution model. It is a small time-boxed test with a kill criterion agreed in writing before it starts. That means: a fixed budget, a fixed end date, one or two things you will look at, and a sentence stating what result causes you to switch it off. Written before, because the entire value of the criterion is that it was set when nobody was invested in the answer. Without it, the pilot never ends. It just becomes an unexamined line item that everyone assumes somebody else validated.
The teams that get the most out of AI spending are not the ones with the most elaborate measurement framework. They are the ones willing to name a decision, instrument it beforehand, hold something back for comparison, count the running cost honestly, and switch off the things that did not work. That last habit is worth more than any metric on the list.
Trying to work out whether an AI feature you are considering is measurable before you commit to building it? A Scoping Sprint ($2,300, two weeks) ends with a measurement plan and baseline defined for your specific workflow, a prototype, and a fixed quote. Or just start a conversation.